

HR outsourcing provider Insperity (NYSE:NSP) met Wall Street’s revenue expectations in Q1 CY2025, with sales up 3.4% year on year to $1.86 billion. Its non-GAAP profit of $1.57 per share was 22.4% below analysts’ consensus estimates.
Is now the time to buy Insperity? Find out by accessing our full research report, it’s free.
Insperity (NSP) Q1 CY2025 Highlights:
- Revenue: $1.86 billion vs analyst estimates of $1.87 billion (3.4% year-on-year growth, in line)
- Adjusted EPS: $1.57 vs analyst expectations of $2.02 (22.4% miss)
- Adjusted EBITDA: $102 million vs analyst estimates of $127.8 million (5.5% margin, 20.2% miss)
- Management lowered its full-year Adjusted EPS guidance to $2.76 at the midpoint, a 21.8% decrease
- EBITDA guidance for the full year is $217.5 million at the midpoint, below analyst estimates of $259.4 million
- Operating Margin: 3.7%, down from 6% in the same quarter last year
- Market Capitalization: $2.96 billion
“Our first quarter financial results, reflecting macro-economic turbulence and healthcare cost volatility, are in stark contrast with the solid execution of our game plan for building the foundation for future growth acceleration,” said Paul J. Sarvadi, Insperity chairman and Chief Executive Officer.
Company Overview
Pioneering the professional employer organization (PEO) industry it helped establish, Insperity (NYSE:NSP) provides human resources outsourcing services to small and medium-sized businesses, handling payroll, benefits, compliance, and HR administration.
Sales Growth
Reviewing a company’s long-term sales performance reveals insights into its quality. Any business can put up a good quarter or two, but many enduring ones grow for years.
With $6.64 billion in revenue over the past 12 months, Insperity is one of the larger companies in the business services industry and benefits from a well-known brand that influences purchasing decisions.
As you can see below, Insperity’s sales grew at a solid 8.6% compounded annual growth rate over the last five years. This shows it had high demand, a useful starting point for our analysis.
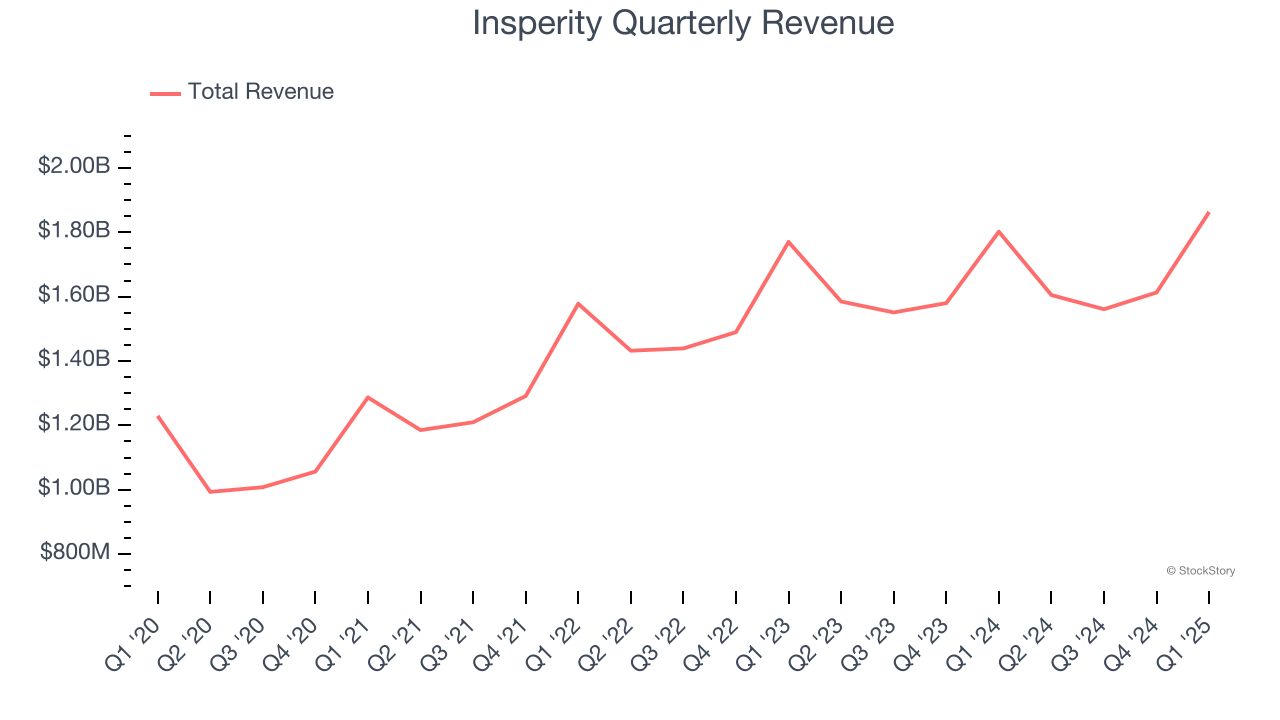
We at StockStory place the most emphasis on long-term growth, but within business services, a half-decade historical view may miss recent innovations or disruptive industry trends. Insperity’s recent performance shows its demand has slowed as its annualized revenue growth of 4.1% over the last two years was below its five-year trend. 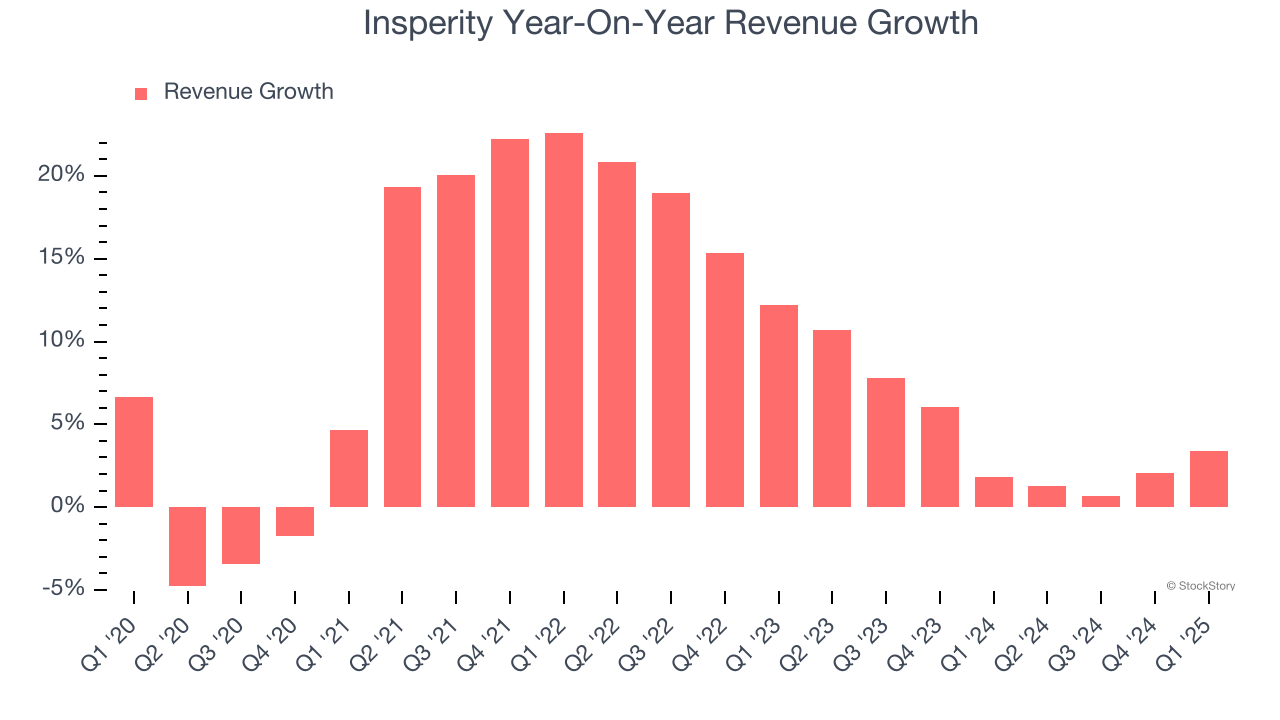
This quarter, Insperity grew its revenue by 3.4% year on year, and its $1.86 billion of revenue was in line with Wall Street’s estimates.
Looking ahead, sell-side analysts expect revenue to grow 5.7% over the next 12 months, an improvement versus the last two years. This projection is above the sector average and indicates its newer products and services will spur better top-line performance.
Unless you’ve been living under a rock, it should be obvious by now that generative AI is going to have a huge impact on how large corporations do business. While Nvidia and AMD are trading close to all-time highs, we prefer a lesser-known (but still profitable) stock benefiting from the rise of AI. Click here to access our free report one of our favorites growth stories.
Operating Margin
Operating margin is a key measure of profitability. Think of it as net income - the bottom line - excluding the impact of taxes and interest on debt, which are less connected to business fundamentals.
Insperity was profitable over the last five years but held back by its large cost base. Its average operating margin of 3.2% was weak for a business services business.
Looking at the trend in its profitability, Insperity’s operating margin decreased by 3.3 percentage points over the last five years. This raises questions about the company’s expense base because its revenue growth should have given it leverage on its fixed costs, resulting in better economies of scale and profitability. Insperity’s performance was poor no matter how you look at it - it shows that costs were rising and it couldn’t pass them onto its customers.
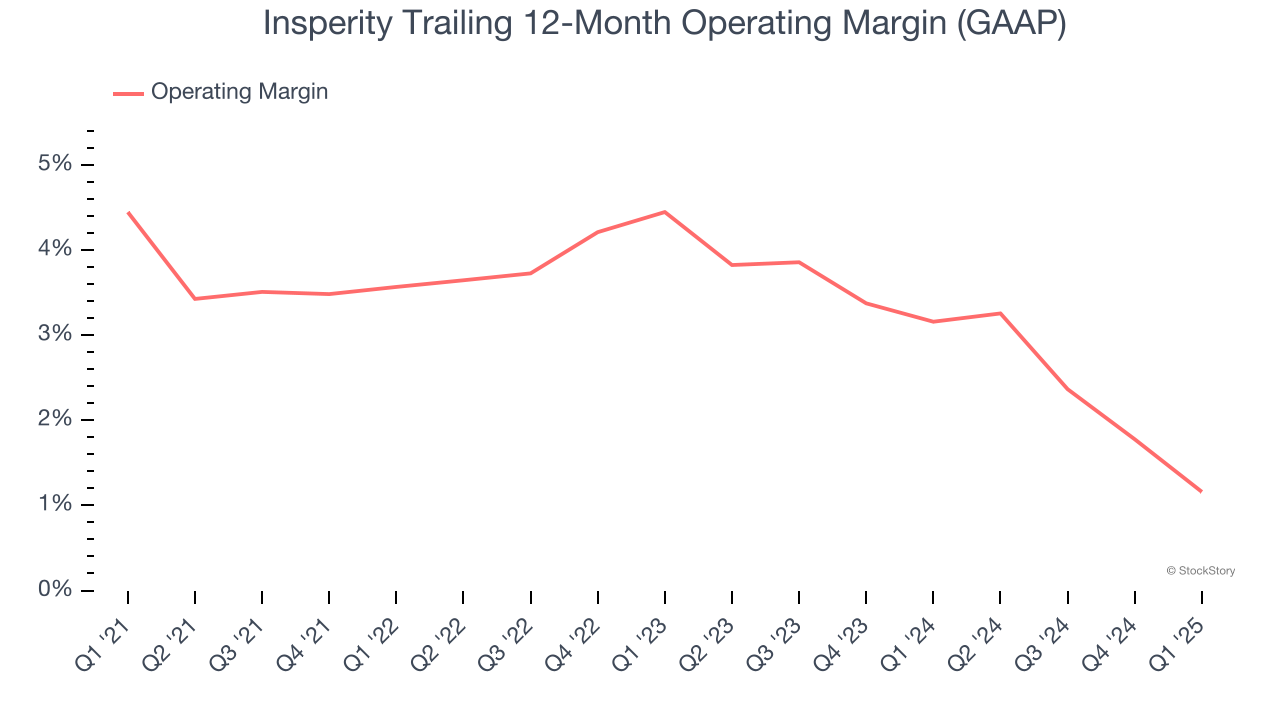
This quarter, Insperity generated an operating profit margin of 3.7%, down 2.3 percentage points year on year. This contraction shows it was less efficient because its expenses grew faster than its revenue.
Earnings Per Share
We track the long-term change in earnings per share (EPS) for the same reason as long-term revenue growth. Compared to revenue, however, EPS highlights whether a company’s growth is profitable.
Sadly for Insperity, its EPS declined by 5.7% annually over the last five years while its revenue grew by 8.6%. This tells us the company became less profitable on a per-share basis as it expanded due to non-fundamental factors such as interest expenses and taxes.
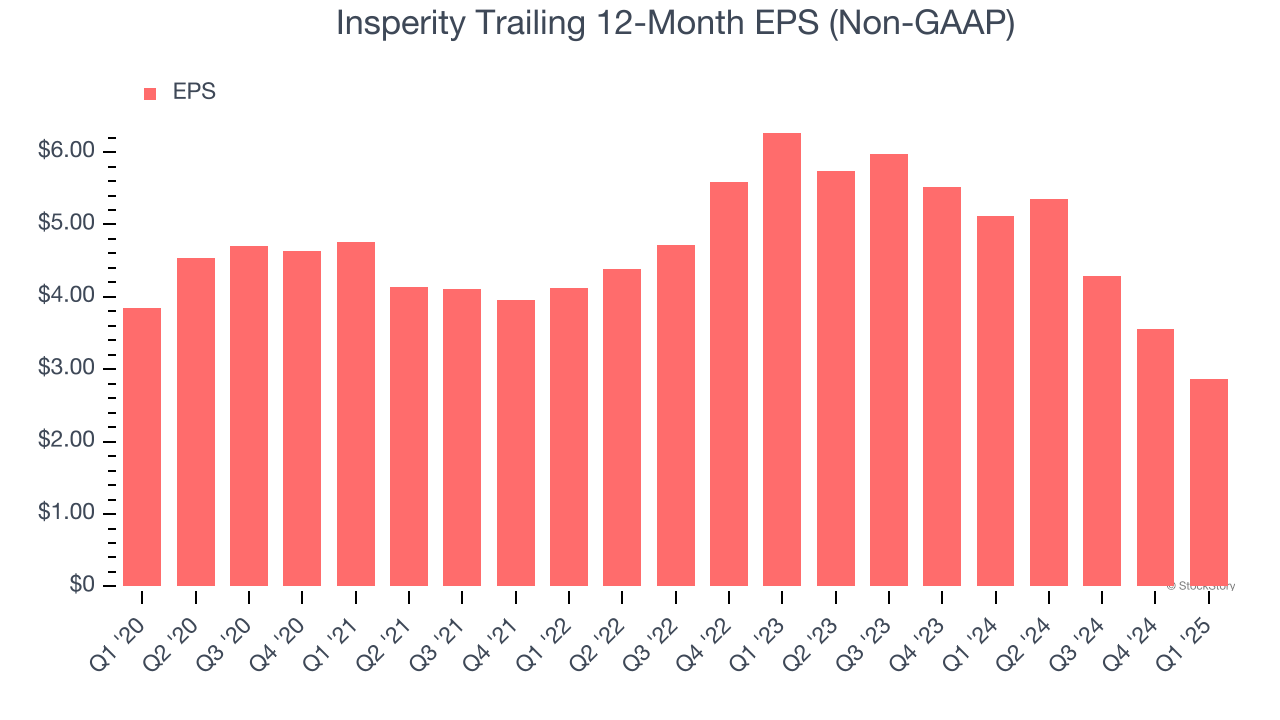
We can take a deeper look into Insperity’s earnings to better understand the drivers of its performance. As we mentioned earlier, Insperity’s operating margin declined by 3.3 percentage points over the last five years. This was the most relevant factor (aside from the revenue impact) behind its lower earnings; taxes and interest expenses can also affect EPS but don’t tell us as much about a company’s fundamentals.
In Q1, Insperity reported EPS at $1.57, down from $2.27 in the same quarter last year. This print missed analysts’ estimates. Over the next 12 months, Wall Street expects Insperity’s full-year EPS of $2.86 to grow 29.1%.
Key Takeaways from Insperity’s Q1 Results
We struggled to find many positives in these results as it lowered its full-year guidance while missing Wall Street’s EPS and EBITDA estimates. Overall, this was a softer quarter. The stock traded down 13.4% to $68 immediately following the results.
Insperity’s latest earnings report disappointed. One quarter doesn’t define a company’s quality, so let’s explore whether the stock is a buy at the current price. If you’re making that decision, you should consider the bigger picture of valuation, business qualities, as well as the latest earnings. We cover that in our actionable full research report which you can read here, it’s free.