

Maritime transportation company Matson (NYSE:MATX) reported Q2 CY2026 results beating Wall Street’s revenue expectations, with sales up 16.7% year on year to $969.4 million. Its GAAP profit of $4.27 per share was 11.8% above analysts’ consensus estimates.
Is now the time to buy Matson? Find out by accessing our full research report, it’s free.
Matson (MATX) Q2 CY2026 Highlights:
- Revenue: $969.4 million vs analyst estimates of $894 million (16.7% year-on-year growth, 8.4% beat)
- EPS (GAAP): $4.27 vs analyst estimates of $3.82 (11.8% beat)
- Adjusted EBITDA: $211 million vs analyst estimates of $195.2 million (21.8% margin, 8.1% beat)
- Operating Margin: 16.4%, up from 13.1% in the same quarter last year
- Free Cash Flow was -$39.2 million, down from $19.3 million in the same quarter last year
- Market Capitalization: $6.13 billion
Company Overview
Founded by a Swedish orphan, Matson (NYSE:MATX) is a provider of ocean transportation and logistics services.
Revenue Growth
Examining a company’s long-term performance can provide clues about its quality. Any business can experience short-term success, but top-performing ones enjoy sustained growth for years. Unfortunately, Matson’s 3.4% annualized revenue growth over the last five years was sluggish. This was below our standard for the industrials sector and is a rough starting point for our analysis.
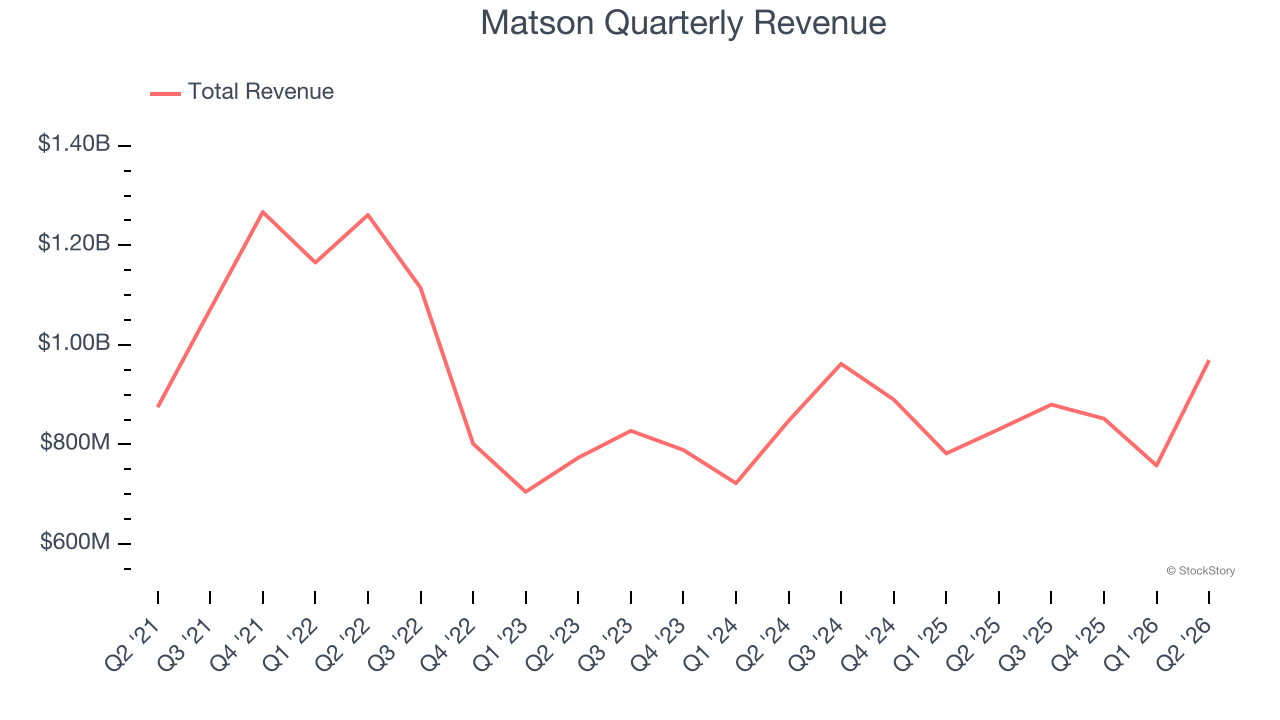
Long-term growth is the most important, but within industrials, a half-decade historical view may miss new industry trends or demand cycles. Matson’s annualized revenue growth of 4.2% over the last two years aligns with its five-year trend, suggesting its demand was consistently weak. 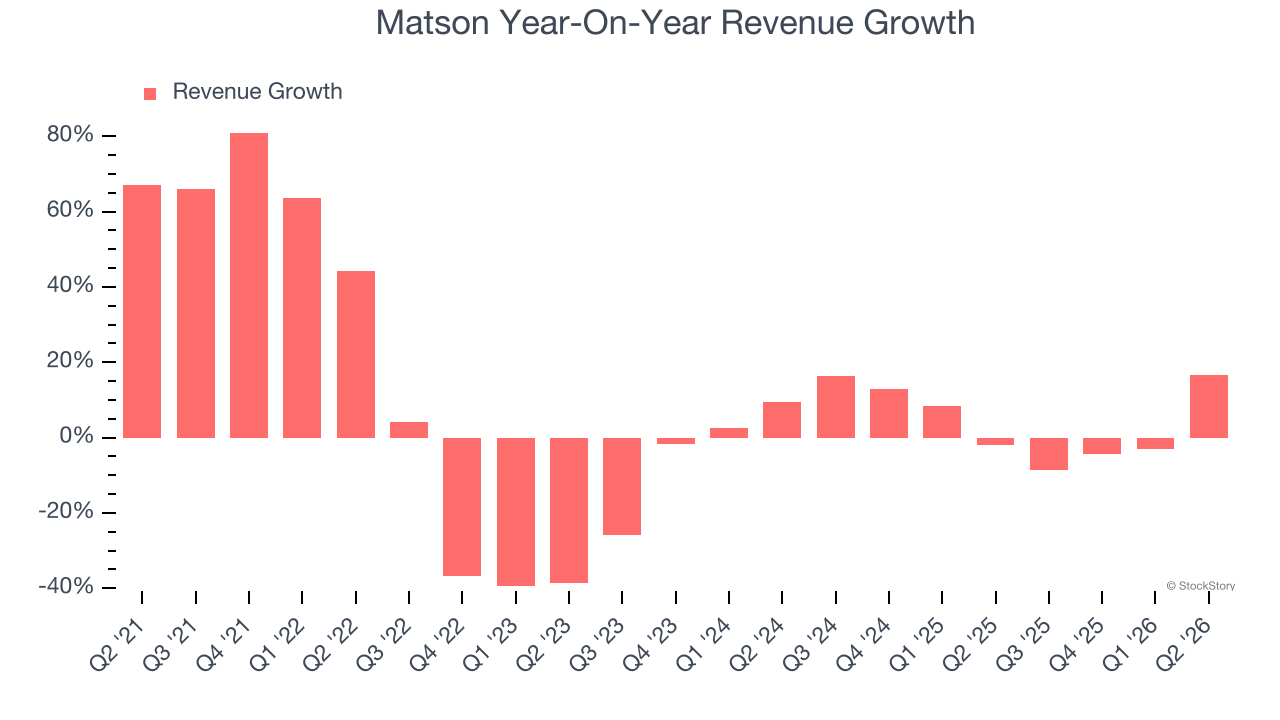
This quarter, Matson reported year-on-year revenue growth of 16.7%, and its $969.4 million of revenue exceeded Wall Street’s estimates by 8.4%.
Looking ahead, sell-side analysts expect revenue to grow 2.3% over the next 12 months, a slight deceleration versus the last two years. This projection doesn’t excite us and implies its products and services will face some demand challenges.
ONE MORE THING: 3 Hidden Platforms Growing 3X Faster than Amazon, Google, and PayPal. Amazon, Google, and Meta all followed the same playbook: Dominate an ignored market. Build an unbeatable moat. Scale until you’re unstoppable.
These three platforms are running that exact playbook right now. The early investors in Amazon made fortunes. The early investors in these could do the same. Get All 3 Stocks Here for FREE.
Operating Margin
Operating margin is an important measure of profitability as it shows the portion of revenue left after accounting for all core expenses — everything from the cost of goods sold to advertising and wages. It’s also useful for comparing profitability across companies with different levels of debt and tax rates because it excludes interest and taxes.
Matson has been a well-oiled machine over the last five years. It demonstrated elite profitability for an industrials business, boasting an average operating margin of 20.3%. This result was particularly impressive because of its low gross margin, which is mostly a factor of what it sells and takes huge shifts to move meaningfully. Companies have more control over their operating margins, and it’s a show of well-managed operations if they’re high when gross margins are low.
Analyzing the trend in its profitability, Matson’s operating margin decreased by 20.9 percentage points over the last five years. This raises questions about the company’s expense base because its revenue growth should have given it leverage on its fixed costs, resulting in better economies of scale and profitability.
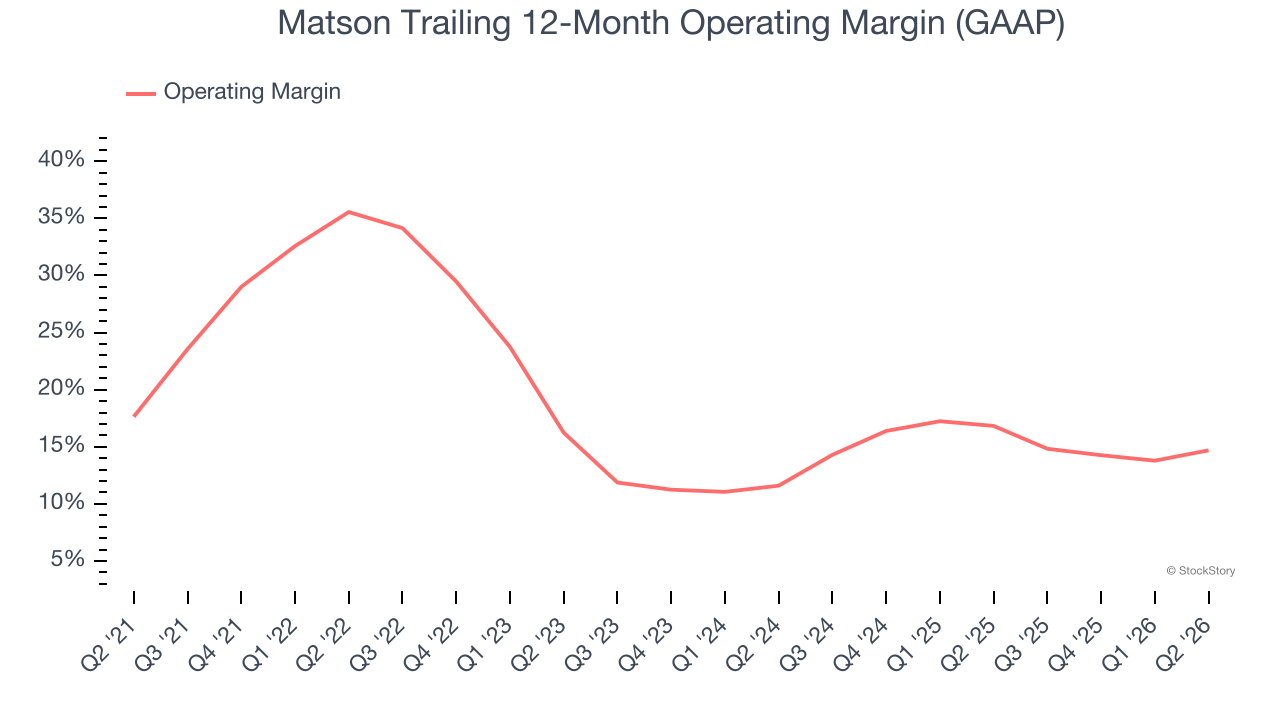
In Q2, Matson generated an operating margin profit margin of 16.4%, up 3.3 percentage points year on year. The increase was encouraging, and because its operating margin rose more than its gross margin, we can infer it was more efficient with expenses such as marketing, R&D, and administrative overhead.
Earnings Per Share
Revenue trends explain a company’s historical growth, but the long-term change in earnings per share (EPS) points to the profitability of that growth — for example, a company could inflate its sales through excessive spending on advertising and promotions.
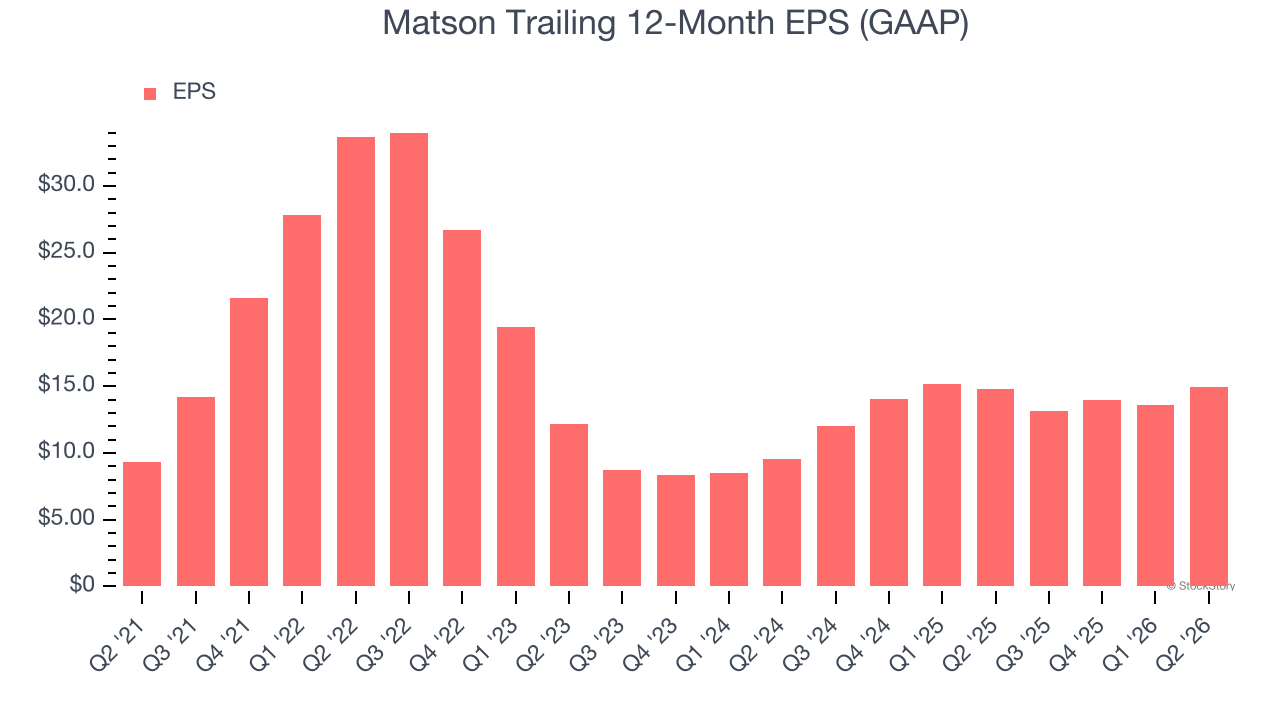
Matson’s EPS grew at 10% compounded annual growth rate over the last five years, higher than its 3.4% annualized revenue growth. However, this alone doesn’t tell us much about its business quality because its operating margin didn’t improve.
Diving into Matson’s quality of earnings can give us a better understanding of its performance. A five-year view shows that Matson has repurchased its stock, shrinking its share count by 30.8%. This tells us its EPS outperformed its revenue not because of increased operational efficiency but financial engineering, as buybacks boost per share earnings. 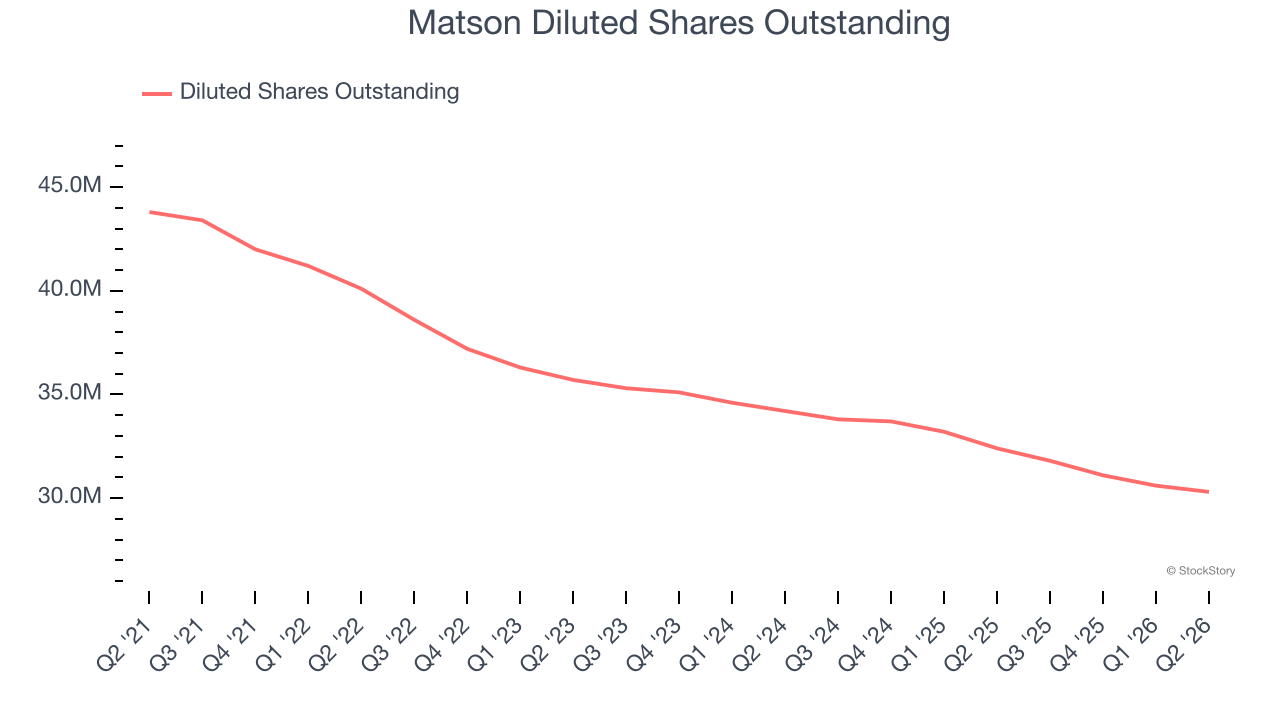
Like with revenue, we analyze EPS over a shorter period to see if we are missing a change in the business.
For Matson, its two-year annual EPS growth of 25.3% was higher than its five-year trend. We love it when earnings growth accelerates, especially when it accelerates off an already high base.
In Q2, Matson reported EPS of $4.27, up from $2.92 in the same quarter last year. This print easily cleared analysts’ estimates, and shareholders should be content with the results. Over the next 12 months, Wall Street expects Matson’s full-year EPS to grow 3.7% from $14.96 to $15.51.
Key Takeaways from Matson’s Q2 Results
We were impressed by how significantly Matson blew past analysts’ EBITDA expectations this quarter. We were also excited its revenue outperformed Wall Street’s estimates by a wide margin. Zooming out, we think this was a solid print. The stock remained flat at $207.45 immediately following the results.
Is Matson an attractive investment opportunity at the current price? When making that decision, it’s important to consider its valuation, business qualities, as well as what has happened in the latest quarter. We cover that in our actionable full research report which you can read here (it’s free).